Car theft is a growing concern in Ottawa, with significant increases in incidents over recent years. Understanding the patterns and trends behind these crimes is crucial for vehicle owners and policymakers alike. This analysis delves into the most targeted car makes, theft hotspots, recovery rates, and the manufacturing years of stolen vehicles to provide a comprehensive overview of car theft in Ottawa from 2018 to 2023.
By identifying these trends, we can uncover insights into the methods and motivations of car thieves and explore measures to protect vehicles against theft.
Which vehicle manufacturer is stolen the most in Ottawa?

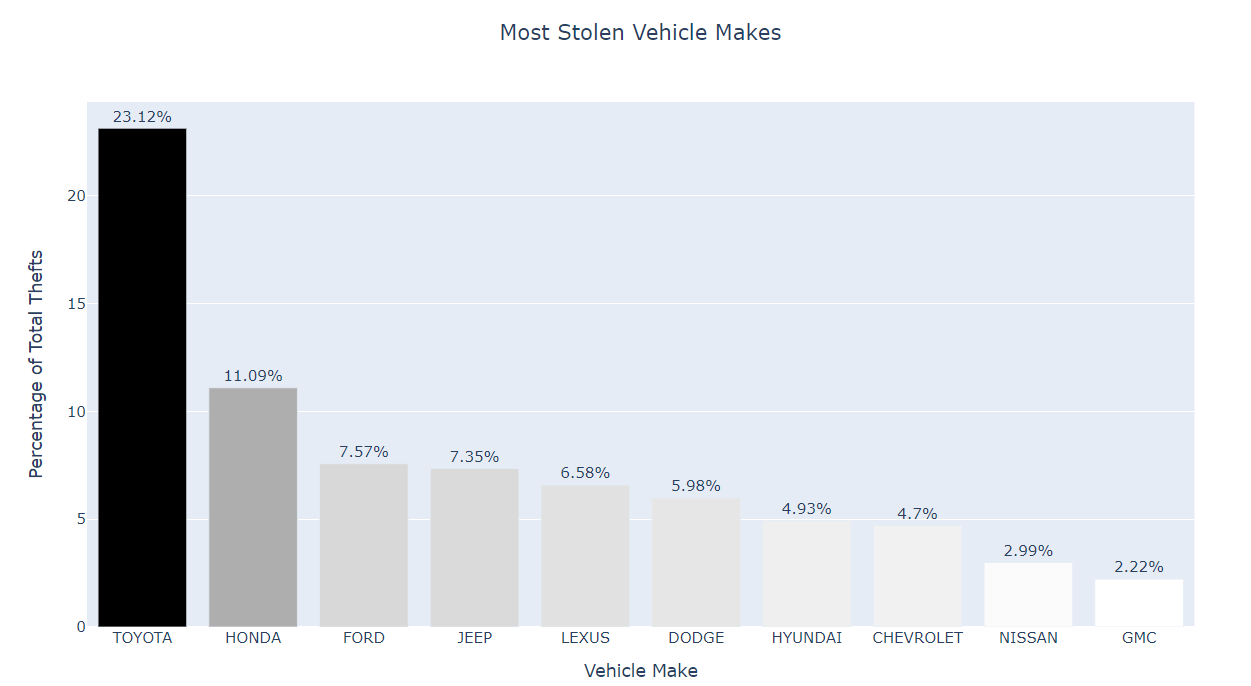
WHICH VEHICLE MAKE IS STOLEN THE MOST
| Ranking | Percentage | Vehicle Make |
|---|---|---|
| 1 | 23.12% | TOYOTA |
| 2 | 11.09% | HONDA |
| 3 | 7.57% | FORD |
| 4 | 7.35% | JEEP |
| 5 | 6.58% | LEXUS |
| 6 | 5.98% | DODGE |
| 7 | 4.93% | HYUNDAI |
| 8 | 4.70% | CHEVROLET |
| 9 | 2.99% | NISSAN |
| 10 | 2.22% | GMC |
From the analysis of 7,865 cars, the most stolen car manufacturer in Ottawa is Toyota, accounting for 23.12% of the total stolen vehicles. This is significantly higher than the second-ranked Honda at 11.09%, making Toyota a prime target for car thieves in the region.
One of the primary reasons Toyotas are highly targeted by thieves in Ottawa is due to a new and highly effective theft method. Thieves disconnect a headlight to access the vehicle's wiring, then connect a CAN (Controller Area Network) computer to it. This bypasses the vehicle's security system, allowing them to unlock the doors and steal the car in under two minutes.
This method exploits the advanced electronics in modern vehicles, highlighting how technological sophistication in cars can inadvertently become a vulnerability when security measures are compromised.
Check out the top 10 most stolen cars in Ontario.👇

Where are the car theft hotspots in Ottawa?

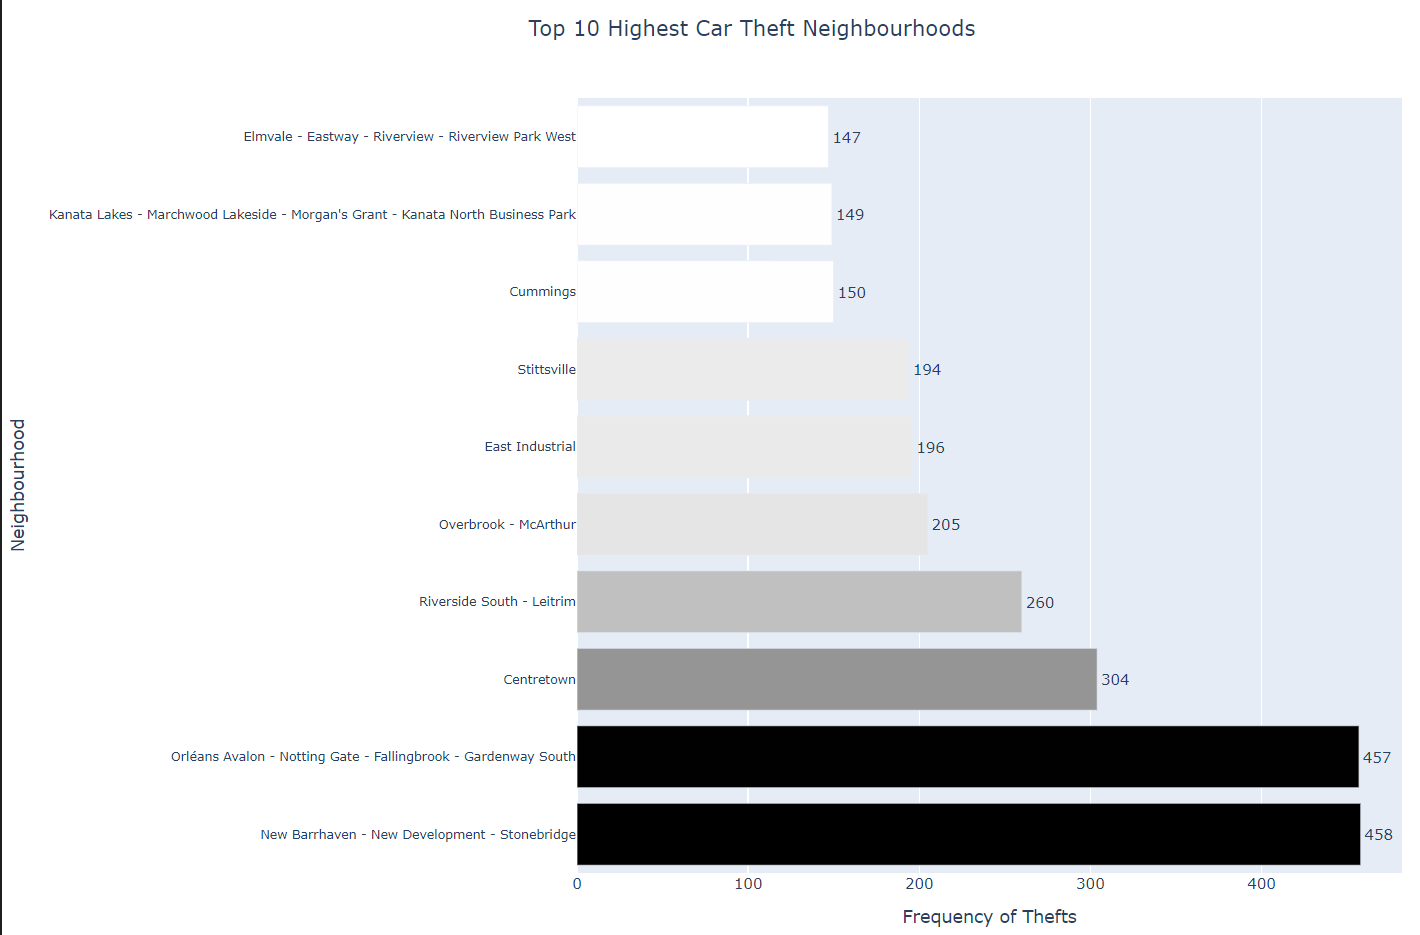
Top 10 Highest Car Theft Neighbourhoods
| Ranking | Neighbourhood | Frequency |
|---|---|---|
| 1 | New Barrhaven - New Development - Stonebridge | 458 |
| 2 | Orléans Avalon - Notting Gate - Fallingbrook - Gardenway South | 457 |
| 3 | Centretown | 304 |
| 4 | Riverside South - Leitrim | 260 |
| 5 | Overbrook - McArthur | 205 |
| 6 | East Industrial | 196 |
| 7 | Stittsville | 194 |
| 8 | Cummings | 150 |
| 9 | Kanata Lakes - Marchwood Lakeside - Morgan's Grant - Kanata North Business Park | 149 |
| 10 | Elmvale - Eastway - Riverview - Riverview Park West | 147 |
The analysis reveals the top car theft hotspots in Ottawa, with New Barrhaven - New Development - Stonebridge leading as the most affected neighborhood, reporting 458 thefts. It is closely followed by Orléans Avalon - Notting Gate - Fallingbrook - Gardenway South with 457 thefts, indicating these areas are highly targeted.
Other notable hotspots include:
- Centretown (304 thefts)
- Riverside South - Leitrim (260 thefts)
- Overbrook - McArthur (205 thefts)
These neighborhoods may be attractive to thieves due to factors like high vehicle density, proximity to major highways, or limited surveillance.
Are stolen cars recovered?
Recovery Rate
| Recovery | Counts | Percentage |
|---|---|---|
| No | 3369 | 42.84% |
| Yes | 4496 | 57.16% |
From 2018 to 2023, the data shows that 57.16% of stolen vehicles in Ottawa were recovered, leaving 42.84% unrecovered. This indicates that while more than half of the stolen cars are eventually found, a significant portion remains unaccounted for.
This recovery rate could be influenced by several factors, such as the sophistication of theft methods, the demand for specific vehicles in the illegal market, and the efficiency of law enforcement and recovery technologies.
Vehicle Make Recovery Data
| Vehicle Make | Not Recovered | Recovered | Grand Total | Recovery Rate |
|---|---|---|---|---|
| HYUNDAI | 61 | 303 | 364 | 83.24% |
| NISSAN | 54 | 167 | 221 | 75.57% |
| CHEVROLET | 89 | 258 | 347 | 74.35% |
| FORD | 163 | 396 | 559 | 70.84% |
| GMC | 55 | 109 | 164 | 66.46% |
| DODGE | 166 | 276 | 442 | 62.44% |
| HONDA | 338 | 481 | 819 | 58.73% |
| TOYOTA | 859 | 849 | 1708 | 49.71% |
| JEEP | 274 | 269 | 543 | 49.54% |
| LEXUS | 292 | 194 | 486 | 39.92% |
The recovery rates for the top 10 most stolen car brands in Ottawa reveal significant variation across different makes. Here's an analysis of the findings:
Top Recovery Rates
- Hyundai (HYUN): The highest recovery rate at 83.24%, indicating effective tracking or lower demand in illicit markets.
- Nissan (NISS): 75.57% recovery rate, suggesting that a substantial number of these vehicles are being successfully retrieved.
- Chevrolet (CHEV): 74.35% recovery rate, ranking third in terms of recovery success.
Lower Recovery Rates
- Toyota (TOYT): Despite being the most stolen brand, only 49.71% of stolen Toyota vehicles are recovered.
- Jeep (JEEP): Similar to Toyota, with a recovery rate of 49.54%, possibly due to sophisticated theft techniques or high demand.
- Lexus (LEXS): The lowest recovery rate at 39.92%, potentially reflecting its high value and demand in black markets.
The disparity in recovery rates could stem from a variety of factors, including theft techniques, resale demand, and tracking capabilities. Toyota and Lexus, despite being popular targets, have notably lower recovery rates, underscoring the need for enhanced security measures for these brands.
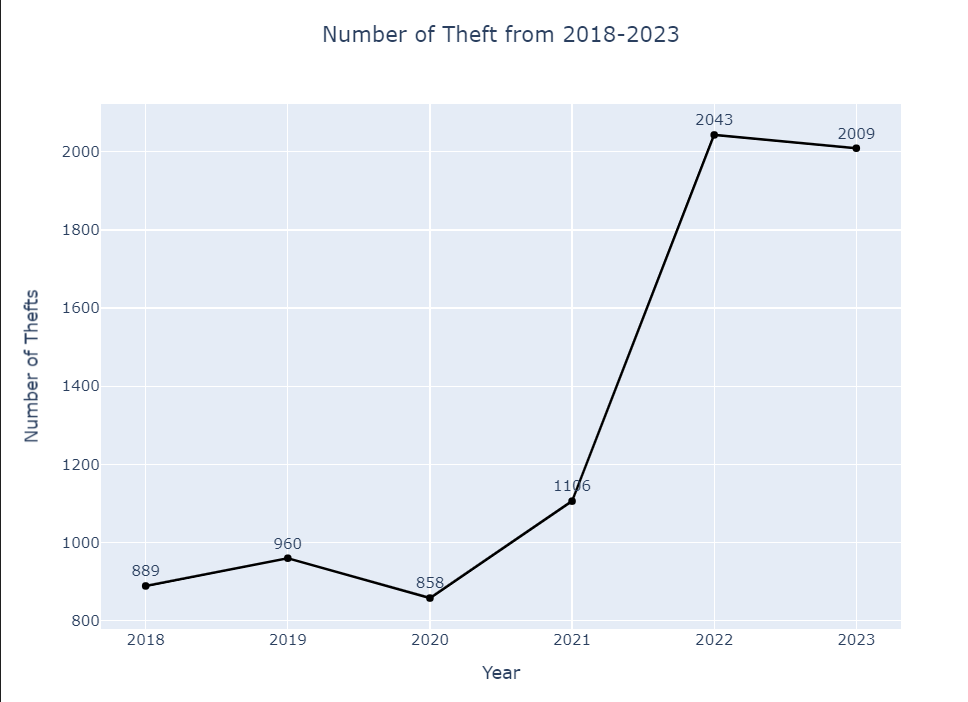
Number of Thefts from 2018-2023

Number of Thefts from 2018-2023
| Year | Number of Thefts |
|---|---|
| 2018 | 889 |
| 2019 | 960 |
| 2020 | 858 |
| 2021 | 1106 |
| 2022 | 2043 |
| 2023 | 2009 |
The data on car thefts in Ottawa from 2018 to 2023 highlights a significant upward trend, particularly in recent years. Here's an analysis:
Yearly Breakdown
- 2018: 889 thefts, marking the baseline for the dataset.
- 2019: 960 thefts, a slight increase (8% growth from 2018).
- 2020: 858 thefts, showing a minor decline, potentially influenced by pandemic-related restrictions.
- 2021: 1,106 thefts, a notable increase (29% growth from 2020).
- 2022: 2,043 thefts, almost doubling the previous year's numbers (84% growth).
- 2023: 2,009 thefts, indicating a slight stabilization but remaining alarmingly high.
Key Observations
- Steep Rise Post-2020: The theft numbers surged dramatically starting in 2021, with 2022 seeing the highest recorded thefts at over 2,000 incidents.
- Pandemic Impact: The decline in 2020 may be tied to reduced activity during COVID-19 lockdowns, followed by a sharp rebound.
The increasing trend from 2021 onwards could be due to factors such as advancements in theft techniques, higher demand for stolen vehicles or parts, and potential gaps in security measures. This rise underscores the need for proactive measures, including improved vehicle security and targeted enforcement strategies.
Wonder what the average Canadian spends on Groceries?👇

Which year had the most cars stolen?
MOST STOLEN CAR MANUFACTURED YEAR
| Ranking | Percentage | Year |
|---|---|---|
| 1 | 13.26% | 2021 |
| 2 | 9.55% | 2020 |
| 3 | 9.32% | 2022 |
| 4 | 8.90% | 2019 |
| 5 | 8.26% | 2018 |
| 6 | 6.38% | 2017 |
| 7 | 4.22% | 2016 |
| 8 | 4.22% | 2015 |
| 9 | 3.42% | 2012 |
| 10 | 3.32% | 2013 |
The analysis of the manufacturing year of stolen cars in Ottawa reveals a strong preference among thieves for newer vehicles. Here's a breakdown:
Top Stolen Manufacturing Years
- 2021: Leading the list, 13.26% of stolen cars were manufactured in this year.
- 2020: The second most targeted year at 9.55%, followed closely by:
- 2022: 9.32%, highlighting the appeal of the most recent models.
Key Observations
- Preference for Newer Cars: Over 40% of stolen cars were manufactured in the last five years (2018–2022), indicating that newer vehicles are prime targets. This could be due to higher resale value, more advanced parts, or perceived demand in black markets.
- Older Models Still Targeted: Cars manufactured in 2012 (3.42%) and 2013 (3.32%) also appear in the top 10, suggesting that specific older models may remain valuable or easier to steal.
The dominance of newer models in theft statistics points to the need for improved security technologies in modern vehicles. Thieves may be leveraging vulnerabilities in advanced electronic systems, such as keyless entry or CAN system bypass methods.
Looking for in-depth analysis to help your business? Reach out to DataHen for expert insights and data solutions tailored to your needs!


