


Accurately estimating house prices is a critical factor in the real estate industry. Buyers, sellers, and investors rely on these predictions to make informed financial decisions.
However, predicting house prices is a challenging task due to the complexity of factors influencing property values, such as location, house condition, number of rooms, and market trends. To address this challenge, advanced machine learning techniques can be used to improve price estimation accuracy.
This study explores how machine learning regression models can analyze house characteristics to predict sale prices with a reliable option.
The research is based on a Kaggle competition dataset, "House Prices: Advanced Regression Techniques" which includes 79 features describing properties in Ames, Iowa.
In this article, we analyze different machine learning models such as Linear Regression, XGBoost, TensorFlow Decision Forest (TF-DF), and XGBoost with Recursive Feature Elimination to help identify the most effective approach for house price prediction.
The primary objectives of this research is as follows:
- Understanding the dataset – Identifying key features that impact house prices.
- Cleaning and preprocessing the data – Handling missing values and encoding categorical variables.
- Testing different regression models – Comparing their accuracy and performance.
- Determining feature importance – Analyzing which attributes contribute the most to price prediction.
- Recommending an optimal approach – Identifying the best-performing model for real estate valuation.
Housing Dataset Overview
The dataset was compiled by Professor Dean De Cock for research purposes and is considered a more detailed alternative to the commonly used Boston Housing dataset.
The Ames dataset includes 79 features that describe various aspects of residential properties in Ames, Iowa. The dataset provides an excellent resource for conducting statistical and machine learning analysis on real estate pricing.
The dataset is categorized into multiple sections, each describing different property characteristics:
- Building Characteristics: Type and style of the building (e.g., MSSubClass, BldgType, HouseStyle).
- Land Specifications: Lot size, shape, and slope (e.g., LotFrontage, LotArea, LotShape, LandSlope).
- Utilities & Facilities: Home utilities and heating systems (e.g., Utilities, Heating, CentralAir, Electrical).
- House Structure: Physical attributes such as YearBuilt, RoofStyle, Foundation, GrLivArea, TotalBsmtSF.
- Quality & Condition: Measures of home quality (e.g., OverallQual, KitchenQual, ExterQual).
- Additional Features: Garage type, pool area, and fencing (e.g., GarageType, PoolArea, Fence).
- Sales Information: Sale process details, including sale type and conditions (e.g., SaleType, SaleCondition).
The target variable for the models is SalePrice, which represents the final selling price of a property.
For a detailed description of these features, refer to the Kaggle dataset link: House Prices: Advanced Regression Techniques.
Cleaning The Dataset
Cleaning the dataset is crucial for ensuring reliable predictions. The following steps were taken:
- Handling Null Values and Creating a New Column
- LotFrontage: Missing values were replaced with the median.
- MasVnrArea: "NA" values were set to 0.
- Electrical: NA values were filled with the most frequent value (mode).
- HowOld: A new column was created to calculate house age at the time of sale (YrSold - YrBuilt).
- Dropping Irrelevant Columns
- Columns with low correlation to SalePrice (-0.3 to 0.3) were considered for removal in Linear Regression.
- XGBoost and TensorFlow Decision Forest models handled null values well, so no features were dropped except for the ID column, which was removed across all models.
- Encoding Categorical Variables
- Categorical features such as MSZoning, HeatingQC, KitchenQual, and GarageType were one-hot encoded for better model performance.
- This step ensures categorical data is properly represented in machine learning models.
These preprocessing steps help refine the dataset for optimal performance in predictive modeling.
Selecting the Right Model for House Price Prediction
After cleaning the dataset, selecting an appropriate model is crucial for accurate house price predictions. Since this is a regression problem, we tested four different models:
- Linear Regression
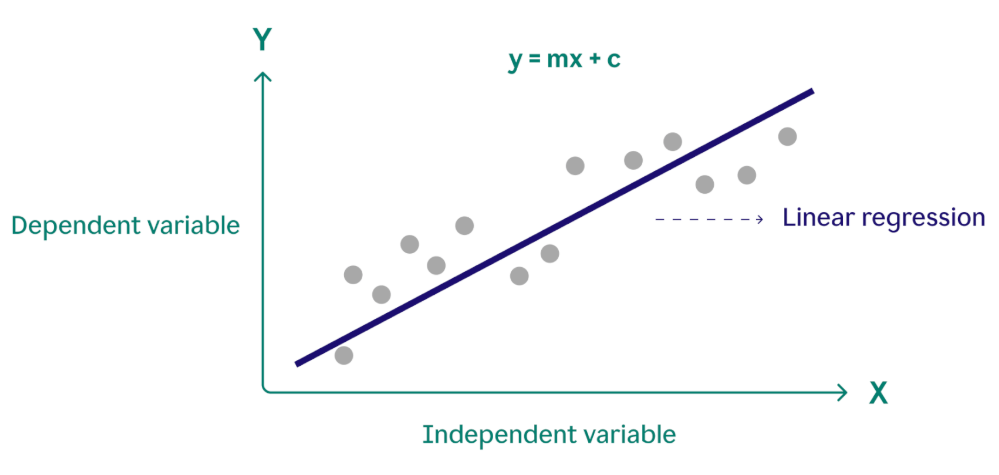
- Simple and interpretable, making it a good baseline.
- Assumes a linear relationship between features and SalePrice.
- Helps identify key features but may not handle complex relationships well.
- XGBoost
- A powerful gradient-boosting algorithm that manages missing values and feature interactions.
- Performs well with structured tabular data like house prices.
- Uses iterative improvements for higher accuracy.
- TensorFlow Decision Forest

- Merges tree-based models with deep learning capabilities.
- Handles categorical variables and missing values automatically.
- Scales well for deployment.
- XGBoost with Recursive Feature Elimination (RFE)
- Iteratively removes less important features to improve efficiency.
- Reduces overfitting while refining feature selection.
- Enhances model accuracy by focusing on the most relevant predictors.
To assess the model performance, we used two key metrics:
- Root Mean Squared Error (RMSE)
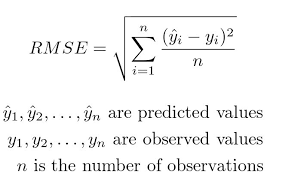
- Measures prediction accuracy by comparing actual vs. predicted values.
- A lower RMSE indicates a better model fit.
- The dataset was split into 80% training and 20% validation for evaluation.
- Learning Curve Analysis

- Examines model performance as the dataset size increases.
- Ideally, both training and validation RMSE should decrease with more data, avoiding overfitting or underfitting.
To analyze deeper into the model performance, we want to know the connection between house features and how important that particular house feature is. Here are the two key metrics:
- Correlation Analysis
- Identifies features with the strongest relationships to SalePrice.
- Helps focus on the most impactful property attributes.
- Feature Importance Analysis
- Determines which factors contribute most to price predictions.
- Provides valuable insights into market trends and real estate pricing strategies.
By evaluating both predictive accuracy and feature influence, we can choose the best model for reliable house price forecasting.
Measuring Model Performance
After selecting different models, we evaluated their performance using Root Mean Squared Error (RMSE) and Learning Curve Analysis to determine their accuracy and generalization ability.
- Serves as the baseline model due to its simplicity.
- Features with correlations above 0.3 were selected to improve accuracy.
- RMSE Results:
- Training: 32,670.60
- Validation: 33,752.98
- The learning curve showed a stable gap between training and validation errors, indicating a well-fitted but simplistic model.
- A powerful gradient-boosting algorithm that iteratively refines predictions.
- RMSE Results:
- Training: 7,883.83
- Validation: 30,824.31
- The learning curve indicated better generalization than Linear Regression but showed some overfitting due to the gap between training and validation errors.
- A tree-based model integrated with TensorFlow, handling categorical variables and missing values automatically.
- RMSE Results:
- Training: 6,895.32
- Validation: 25,709.45
- The learning curve demonstrated minimal overfitting, making it a strong candidate for structured data.
- XGBoost with Recursive Feature Elimination (RFE)
- An optimized approach using feature selection to remove less relevant features and improve generalization.
- RMSE Results:
- Training: 7,238.86
- Validation: 26,251.10
- The reduced training-validation gap indicated improved efficiency compared to standard XGBoost.
Results
- Correlation Analysis
Pearson correlation was used to identify relationships between SalePrice and other features. Features with a correlation between -0.3 and 0.3 were excluded due to weak relationships.
Top positively correlated features:
- OverallQual (0.8+) – Higher-quality materials significantly increase house value.
- GrLivArea (0.7+) – More above-ground living space strongly affects price.
- GarageCars & GarageArea (0.6) – Larger garages add convenience and value.
- TotalBsmtSF & 1stFlrSF (0.5-0.6) – More space, even in basements, increases worth.
- FullBath, TotRmsAbvGrd, Fireplaces (0.4-0.5) – More rooms and amenities improve desirability.
- YearBuilt & YearRemodAdd (0.4-0.5) – Newer homes and recent renovations boost prices.
Only one negatively correlated feature:
- HowOld (-0.4) – Older homes may require more maintenance, slightly reducing value.
While correlation is useful, it doesn’t capture complex interactions between variables.
- Feature Importance Analysis
Unlike correlation, feature importance accounts for multicollinearity and interaction effects between features.
Key Features by Model:
- Linear Regression – Strong predictors: LotFrontage, OverallQual, YearBuilt, GrLivArea, HowOld.
- XGBoost – Highlights OverallQual, GarageCars, FullBath, GrLivArea, 1stFlrSF as top contributors.
- TensorFlow Decision Forest (TF-DF) – Strongest influences: OverallQual, GrLivArea, TotalBsmtSF, GarageCars, LotArea.
- XGBoost with Recursive Feature Elimination (RFE) – Reduced feature set improves efficiency, keeping LotArea, OverallQual, YearBuilt, TotalBsmtSF, FullBath, GarageArea.
To Conclude:
- OverallQual consistently emerges as the strongest feature across all models.
- Living space (GrLivArea, TotalBsmtSF, 1stFlrSF) significantly influences price.
- Garage and bath-related features (GarageCars, FullBath) impact value but less than living space.
- Age-related features (YearBuilt, YearRemodAdd, HowOld) affect the price but depend on maintenance.
These findings provide actionable insights for homebuyers, sellers, and real estate investors, helping prioritize key factors when estimating property values.
Conclusion and Recommendations
After evaluating four machine learning models, TensorFlow Decision Forests (TF-DF) emerged as the best-performing model due to its lowest RMSE, indicating minimal prediction errors and higher accuracy.
Key Features Driving House Prices:
Among the 79 features, these had the most impact on price predictions:
- OverallQual – Material & finish quality.
- LotArea – Total lot size.
- GrLivArea – Above-ground living space.
- TotalBsmtSF – Basement size.
- 1stFlrSF & 2ndFlrSF – First and second-floor areas.
- TotRmsAbvGrd – Number of rooms above ground.
- YearBuilt & YearRemodAdd – Construction & renovation dates.
- HowOld – Age of the property.
- GarageArea & GarageYrBlt – Garage size & build year.
- OpenPorchSF & Fireplaces – Outdoor space & fireplaces.
- FullBath – Number of full bathrooms.
Reducing Features: Does It Affect Accuracy?
Testing a 7-feature subset (BldgType, GarageType, GrLivArea, LotArea, Neighborhood, YearBuilt, YearRemodAdd) with TF-DF showed minimal visual impact but significantly increased RMSE. This suggests that feature interactions play a crucial role in price prediction.
Below is The Table of comparison between 79 original vs 7 key features using the TF-DF Model:
| Machine Learning Model | RMSE Training | RMSE Validation |
|---|---|---|
| Linear Regression | 32670.600 | 33752.980 |
| XGBoost | 7883.830 | 30824.310 |
| TF-DF 79 Features | 6895.320 | 25709.449 |
| XGBoost with RFE | 7238.860 | 26251.100 |
| TF-DF 7 Selected Features | 15871.917 | 34614.015 |
Here are the results:

Key Insights and Recommendations:
- Feature Interactions Matter – Removing certain features weakens the model’s ability to recognize important patterns.
- Additional Missing Factors – To improve predictions, future datasets should consider:
- Proximity to city centers & tourist areas (location impact).
- Tax & VAT considerations (affecting affordability).
- Accessibility for people with disabilities (market demand factor).
- Fire safety features (insurance & buyer confidence).
- Cross-Validation for Robustness – Ensuring feature selection improves model performance across different data splits.
For accurate house price predictions, a comprehensive dataset that captures key market factors and feature interactions is essential. Implementing these insights can refine real estate pricing strategies and optimize investment decisions.
Need high-quality real estate data for your business? DataHen provides expert data analytics services to help you unlock valuable insights and drive smarter decisions. Learn more today!